Creating Waffle Plots (Square Pies) in R
January 8, 2019
Sifting through this master list of Ggplot2 visualizations I realized that I love waffle plots, having seen them be used in a lot of infographics, but I’ve never tried making one myself. Unfortunately the code there is a bit hackish, so here is a quick tutorial on how to create them in R.
Required packages
Luckily we’re aren’t the first people looking for a package to make waffle plots. Bob Rudis has already created a neat package to make this easier called Waffle, however the version on CRAN is outdated, so we need to install devtools and install waffle from github.
install.packages("devtools")
library(devtools)
install_github("hrbrmstr/waffle")
Now lets load the package and verify which version we’re using. The latest release as of the time of writing is 0.9.1.
library(waffle)
packageVersion("waffle")
The library itself is very easy to use, you pass it either a named vector or dataframe, and it plots your waffle plot. You can specify the number of rows to arrange the chart in.
parts <- data.frame(names = c('Boys','Girls'), vals = c(20,20))
waffle(parts, rows = 4)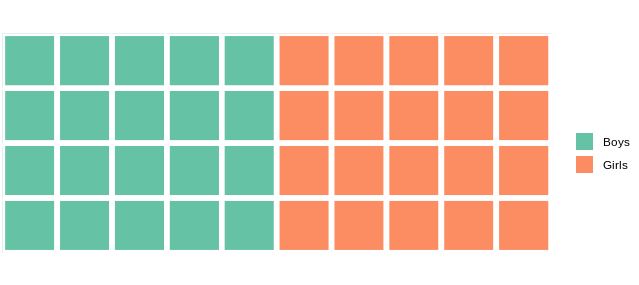
However if you use a row number that the sum of your vals is not divisible by you will get some ‘overhang’ with filler tiles added in, to avoid this behavior specify the colors for your categories.
waffle(parts, rows = 6, colors = c("#FFC0CB", "#FFC0AB"))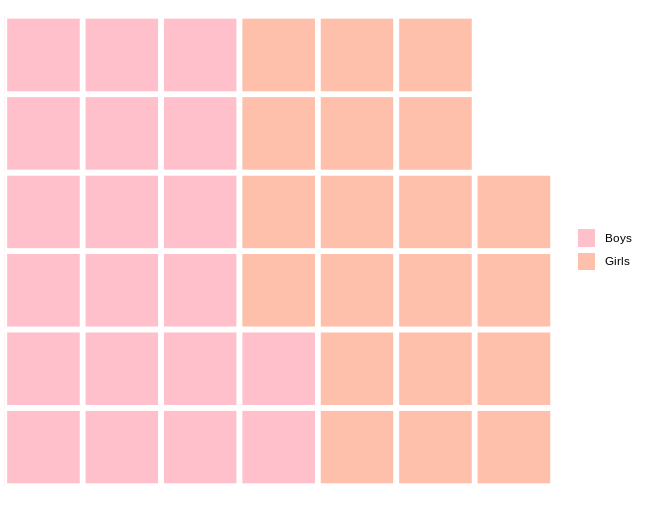
More Advanced Example
What if we want to use something else, other than colored tiles? Well, the package has built in support for FontAwesome glyphs, and comes bundled with them. However I was experiencing a lot of issues with installing the fonts, and making them available to R, which seems to be common, judging by numerous GitHub and StackOverflow threads. Luckily I’ve managed to get this down to a reproducable procedure in R Studio running on Docker, so if it works with a fresh container then it should work with most computers. When you initally run waffle it will make a data frame with Utf-8 values mapped to glyphs from FontAwesome, so if it isn’t already installed you will instead get jibberish.
So first, you need to install FontAwesome on your OS. As I was running my session on Docker we will be giving Debian specific steps on installing fonts, you can run Rstudio as well on Docker by following this simple tutorial.
As waffle comes with FontAwesome bundled, we would like to install that exact same version, so we need to copy it to our fonts folder, and update the fonts cache.
mkdir /usr/local/share/fonts/cust_fonts/
cp /usr/local/lib/R/site-library/waffle/fonts/fontawesome-webfont.ttf /usr/local/share/fonts/cust_fonts/
chmod 755 /usr/local/share/fonts/* -R
chmod 644 /usr/local/share/fonts/cust_fonts/fontawesome-webfont.ttf
fc-cache -fv
Our final step is to check has FA been successfully installed.
fc-list | grep "Awesome"Now is a good time to restart your R session, so that we don’t have issues with cached fonts.
First post-restart step is to install extrafont.
install.packages("extrafontdb", repos = "http://cran.rstudio.com/")
install.packages('extrafont')
library(extrafont)
Then we make FontAwesome available to R via the font_import function, you can use this one without any arguments but that takes a long time to complete.
font_import(paths = dirname('/usr/local/lib/R/site-library/waffle/fonts'), prompt = FALSE)Let’s verify we’ve made FontAwesome available to R.
fonts()And now we can test out our new plot.
parts <- data.frame(names = c('Boys','Girls'), vals = c(20,20))
waffle(
  parts, colors = c("#0000FF","#FFC0CB"),
  use_glyph = "user", size = 8, rows = 4)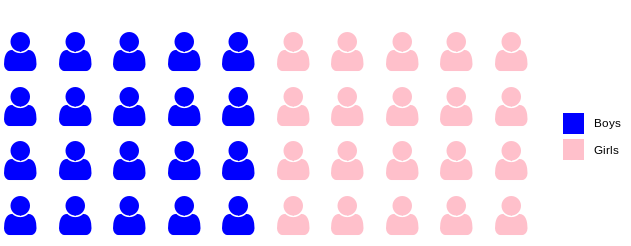
All of this is quite nice and pretty, but it would make sense to use different glyphs for different categories, you can of course do this by passing a list of glyph names to the waffle function.
waffle(
  parts, colors = c("#0000FF","#FFC0CB"),
  use_glyph = c("female", "male"), size = 8, rows = 4)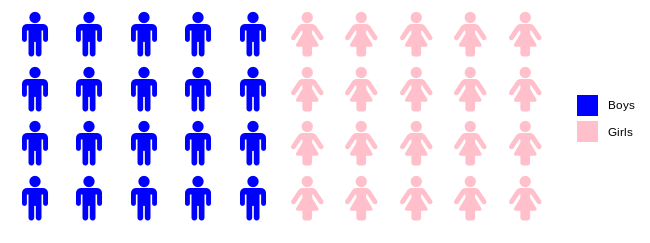
And that’s it! Apart from having issues with installing fonts, it is pretty simple to create waffle plots, so now I’ll be able to spam my twitter followers with colorful infographics, and so will you.