Election Analysis - Part 1
September 26, 2018
Introduction
Elections in the USA are the wet dream of any data nerd. Regular pre-election polls, exit polls, data on constituent demographics, available by ZIP code, social strata, race or ethnicity, you name it and it probably exists. Unfortunately I’m not from the US, I’m from Bosnia and Herzegovina, the best we can hope for is that the election website publishes the results on time. Due to the American elections boiling down to just two parties, the concept of a ‘swing state’ or swing county has been present in their analytical landscape for quite some time. What it refers to is regions where the vote is tightly contested between the two parties, so while the North might go Democrat far more than the South, we can’t say that about Ohio, Florida, Virginia, Nevada etc. Due to the wealth of data available for the US a great level of granularity is possible, which has some unfortunate side-effects such as gerrymandering, but that is a topic for a different post.
Like many others, I have been consistently disappointed by the “analyses” offered from local polytical analysts, because for the life of me I’m unable to remember when have I ever heard any talk of election polls, or any kind of data being used to support their arguments, which were almost entirely based on personal opinions. As someone whose job involves working with data this annoyed me to a great extent so I decided to do something about it, therefore several months ago I decided to see if I could determine were there any “swing municipalities” in Bosnia, ie. locations where the voters were willing to change their favorite party.
The initial idea was to make a map that would go down to the street level, to be used as a tool to see with a great level of detail which neighboorhoods are likely to change favorites, this however turned out to be impossible, due to the polling stations, and which streets belong to which polling station being under the authority of the municipal election commissions, of which there are 140, and with only a few of them publishing these documents online.
The rest of this blog post rests on two assumptions and one variable:
- Polling stations can be used as a proxy value for voters, so instead of looking at the overall winner by each municipality I am instead looking at each polling station, to see did that polling station change its favourite party. Please note that due to the complex Bosnian electoral system the number of levels of government that a polling station can vote for differ, so for the sake of simplicity I’ve decided to count each level of government as a separate polling station.
- Polling stations always match to the same geographic area. Since the streets that are covered by each polling station are determined by the local municipal boards, and the law of inertia is the only consistently respected law around here, I assume that there have not been large changes here. This is however not entirely correct, since some polling stations have over time been split into multiple ones (By appending A or B to the name of the original one), but in a vast majority of cases there have not been any changes between 2006 and 2014.
- Delta - measure of change. This is the term I will use for ‘changeability’ of favourite at a polling station.
IMPORTANT NOTE: All that you are about to read is given as is, I do not guarantee for the accuracy and validity of this analysis, this is a side project inspired and financed by my own frustration with my home countries lack of data, and political analysis. In case you notice any mistakes, or have suggestions please contact me so I may correct them
Methodology
Data Collection
Even though the data are available in a digital format (and I luckily do not mean PDF) via izbori.ba they do not provide a way to download them in a tabular format. Luckily after asking around on Twitter I got a DM from Damir Dajanović (@bezrabotni on Twitter, excellent dude), who had acquired them several years ago in the form of Excel spreadsheets. Due to a lack of municipal election data for 2008. I chose to focus solely on general election data for the period 2006. - 2014.
The first issue I ran into was the format of the data, namely the tables used UTF-16LE encoding, and mixed Cyrillic and Latin scripts. This was a real nightmare, as most tools have issues with exotic encodings, so it took me several weeks to clean the dataset into something usable. Additional issues were encountered due to data being missing for several electoral units, forcing me to write a very slow scraper in Selenium as the election website relies heavily on the user sending clicks to UI elements, which would be hard to do with scrapy. After spending quite a while validating the data I believe to have removed most of the issues, however I cannot guarantee that all are gone due to the size of the dataset.
Analysis
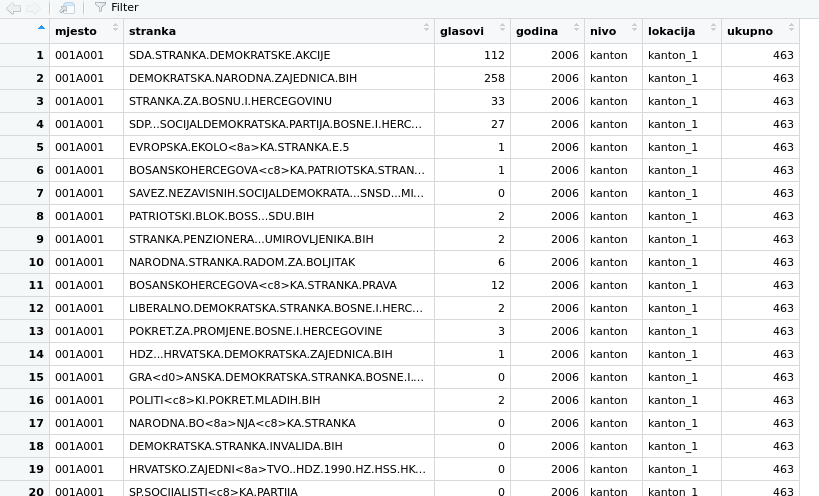
This reduced the size to a more manageable 282,711 rows. The next issue were the party names. The names of the candidates and parties they are in were merged, since I am not interested in individuals I created an additional column to store party name abbreviations, so that “SDA.STRANKA.DEMOKRATSKE.AKCIJE” and “SDA - STRANKA DEMOKRATSKE AKCIJE” would not be considered two separate parties due to these strings not matching 100%. This created a further problem, which were electoral coalitions. This forced me to google every coalition I ran into and create abbreviations for all parties in each coalition.
Once this was painstakingly completed the moment arrived to analyze the data. The algorithm I came up with did the following:
- Select a polling station from the table
- For each level of government at that polling station do the following check:
- If data exists for 2006 and 2010 compare the abbreviated names of the winning party. Each comparison increases the ‘test_event’ variable by 1. We use this value to follow the number of polling stations and levels of government that were voted for, in order to compare later, and convert everything into percentage values. If the winning party differs from 2006 and 2010 increment the ‘delta’ variable by 1.
- Repeat this process for 2010 and 2014, in case of no data existing for 2010 (due to polling station changes) perform a comparison for 2006 and 2014.
- If the winner from one year is part of the winning coalition the next year then do not increment the delta.
- The process repeats for each polling station within a municipality. The sum of the delta and test_event variables are set as the total values of delta and test_event for the municipality.
- Repeat steps 1-3 for all municipalities in Bosnia
For example, a polling station in 2006 receives the highest number of votes for SDA, and in 2010 and 2014 for SDP, the delta of that polling station would be 1. If they voted for a third party in 2014 then their delta would be 2. As the algorithm is sensitive to coalitions, if a polling station in 2006 voted for SNSD, and in 2010 for a coalition of SNSD | DNS | SP the algorithm would not count this as a change in favourite, since the favourite from 2006 was present in the coalition in 2010.
Running the algorithm produces a delta value for each municipality. The number itself is not important, as the number of polling stations differ by municipality, for example Banja Luka has around 250, while Velika Kladusa has around 70, so we need to use percentages values, which would in this case be delta / test_event.
Results
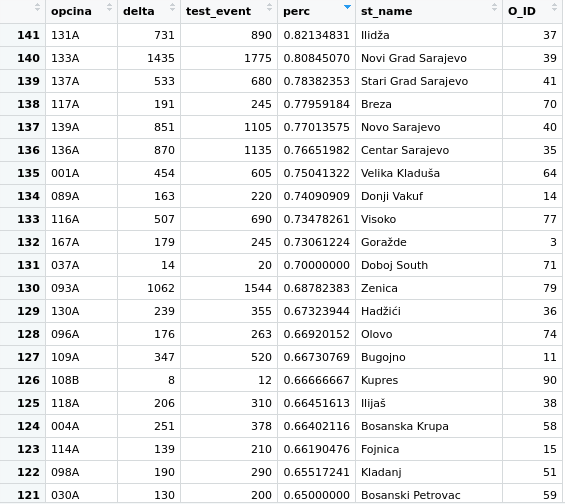
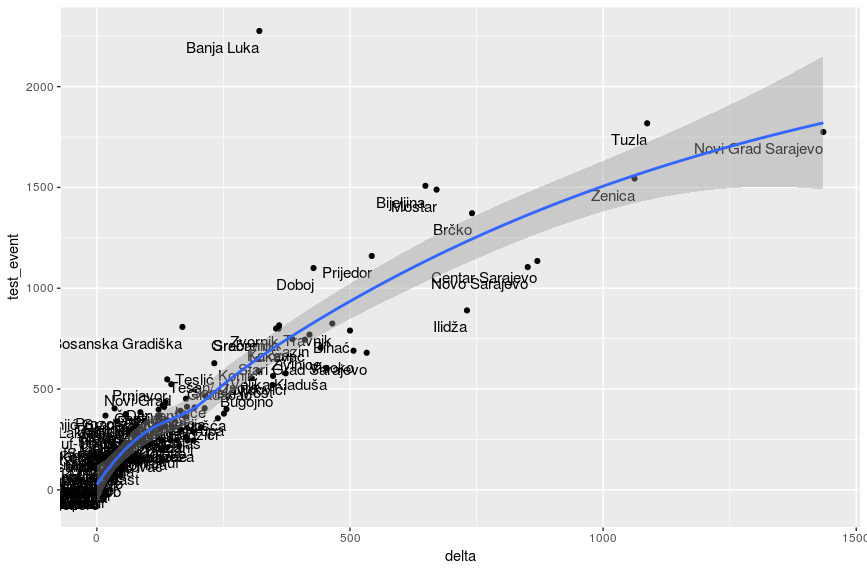
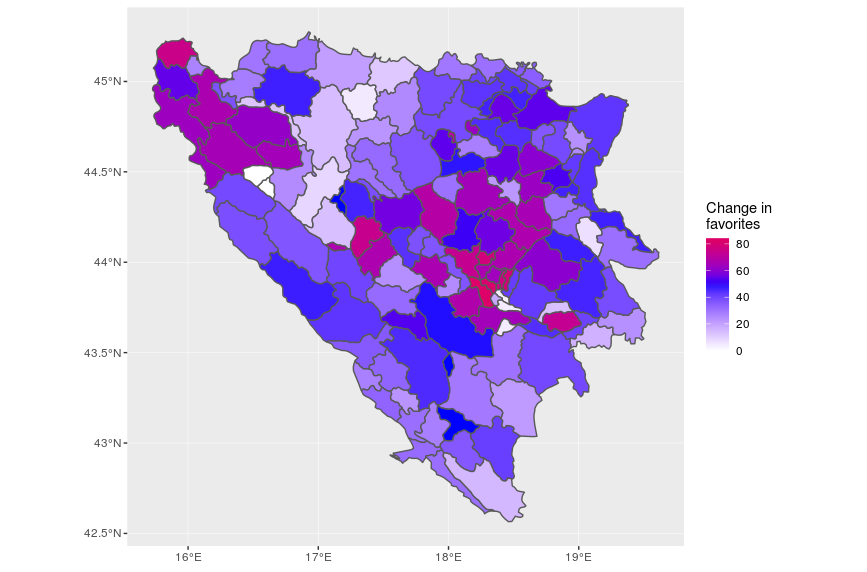
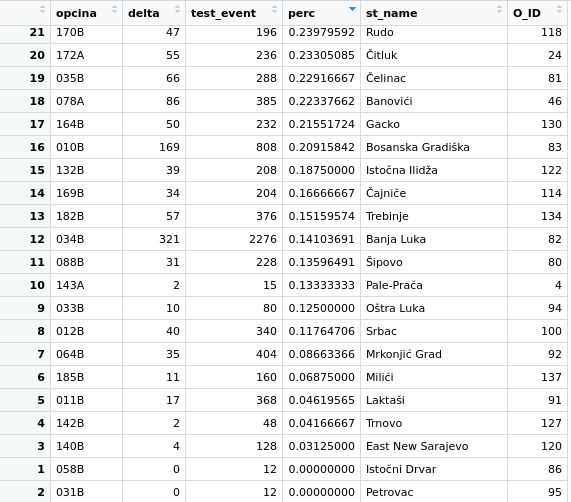 If we were to look at the list as sorted by highest percentage delta we can see that the municipalities of the capital city Sarajevo are the most variable, with Ilidza leading at a whopping 82%, followed closely by Novi Grad and Stari Grad. Looking at the lowest percentage delta we can see the tiny municipalities of Istocni Drvar and Petrovac, as well as Istocno Novo Sarajevo, and Trnovo (RS). A reasonable hypothesis would be to say ‘the bigger the municipality the higher the delta’, to check that out we can do a simple plot to look for any such correlations between the test_event (max number of delta), and delta. This gives us the following plot
As my final plot lets make a map, because why the hell not. We’ll use the percentage delta as the fill value.
Discussion
What is next? Well, we are working on a website where we will make this dataset publicly available, so you can download this data, and play with a map similar to the one above. If you follow this blog until the election there will be some further analyses, after the election I’ll shift topics. Realistically speaking this is just a baby step for Bosnian political analysis, I am certain that these things are somewhat known already, to both the political parties and the general public, however I’ve never seen then presented in this way, though I would like to see more analyses that employ data, as well as data visualizations. Additionally, I’d love if CIK (Central Election Commission of BiH) would open the gates of their database to the general public, by allowing us to download XLSX or CSV tables of previous election results, preferably written in a latin alphabet and in UTF-8 encoding.
Feel free to send me suggestions and comments.